Calculates correlations matrices. Relevant values are stored in a list with methods for easy retrieval and formatting in publication ready tables.
corx(
  data,
  x = NULL,
  y = NULL,
  z = NULL,
  method = c("pearson", "spearman", "kendall"),
  stars = c(0.05, 0.01, 0.001),
  p_adjust = c("none", "holm", "hochberg", "hommel", "bonferroni", "BH", "BY", "fdr"),
  round = 2,
  remove_lead = TRUE,
  triangle = NULL,
  caption = NULL,
  note = NULL,
  describe = FALSE,
  grey_nonsig = TRUE,
  call_only = FALSE
)
Arguments
- data
data.frame or matrix
- x
a vector of rownames. Defaults to all
- y
a vector of colnames. If not supplied, y is set to x.
- z
a vector of variable names. Control variables to be used in partial correlations - defaults to NULL
- method
character. One of "pearson", "spearman", or "kendall"
- stars
a numeric vector. This argument defines cut-offs for p-value stars.
- p_adjust
character. What adjustment for multiple tests should be used? One of "none" (default), "holm", "hochberg", "hommel", "bonferroni", "BH", "BY", or "fdr"
- round
numeric. Number of digits in printing
- remove_lead
logical. if TRUE (the default), leading zeros are removed in summaries
- triangle
character. one of "lower", "upper" or NULL (the default)
- caption
character. table caption. Passed to plots
- note
character. Text for a table note
- describe
list of named functions. If functions are supplied to describe, new columns will be bound to the 'APA matrix' for each function in the list. Describe also accepts a variety of shortcuts. If describe is set to TRUE, mean and standard deviation are returned for all row variables. Describe can accept a character vector to call the following descriptive functions: c('mean','sd','var','median','iqr','skewness','kurtosis'). These shortcuts are powered by 'tidyselect'. Skewness and kurtosis are calculated using the 'moments' package. All functions retrieved with shortcuts remove missing values.
- grey_nonsig
logical. Should non-significant values be grey in output? This argument does nothing if describe is not set to FALSE
- call_only
logical. For debugging, if TRUE only the call is returned
Value
A list of class 'corx' which includes:
"call" The call which if evaluated reproduces the object
"apa" An 'APA' formatted correlation matrix with significance stars
"r" Raw correlation coefficients
"p" p-values
"n" Pairwise observations
"caption" Object caption
"note" Object note
Details
Constructs correlation matrices using 'stats::cor.test' unless z is specified. When z is specified ppcor::ppcor.test is used instead. Character and factor variables are not accepted. To prevent errors, users must first convert all variables to numeric.
Partial correlations
Supplying the argument z will call ppcor::pcor.test the correlation pair are supplied to arguments x and y. The vector of z given to corx is passed to argument z in pcor.test.
Missing data
Observations containing missing data required to complete a correlation or partial correlation are automatically removed.
P-adjust
P-values attained can be adjusted for multiple comparisons by using the 'p_adjust' argument. This calls the function stats::p.adjust. When a matrix is symmetrical, p-values are only adjusted for unique comparisons. When a correlation matrix is not symmetrical, all comparisons are assumed to be unique.
Examples
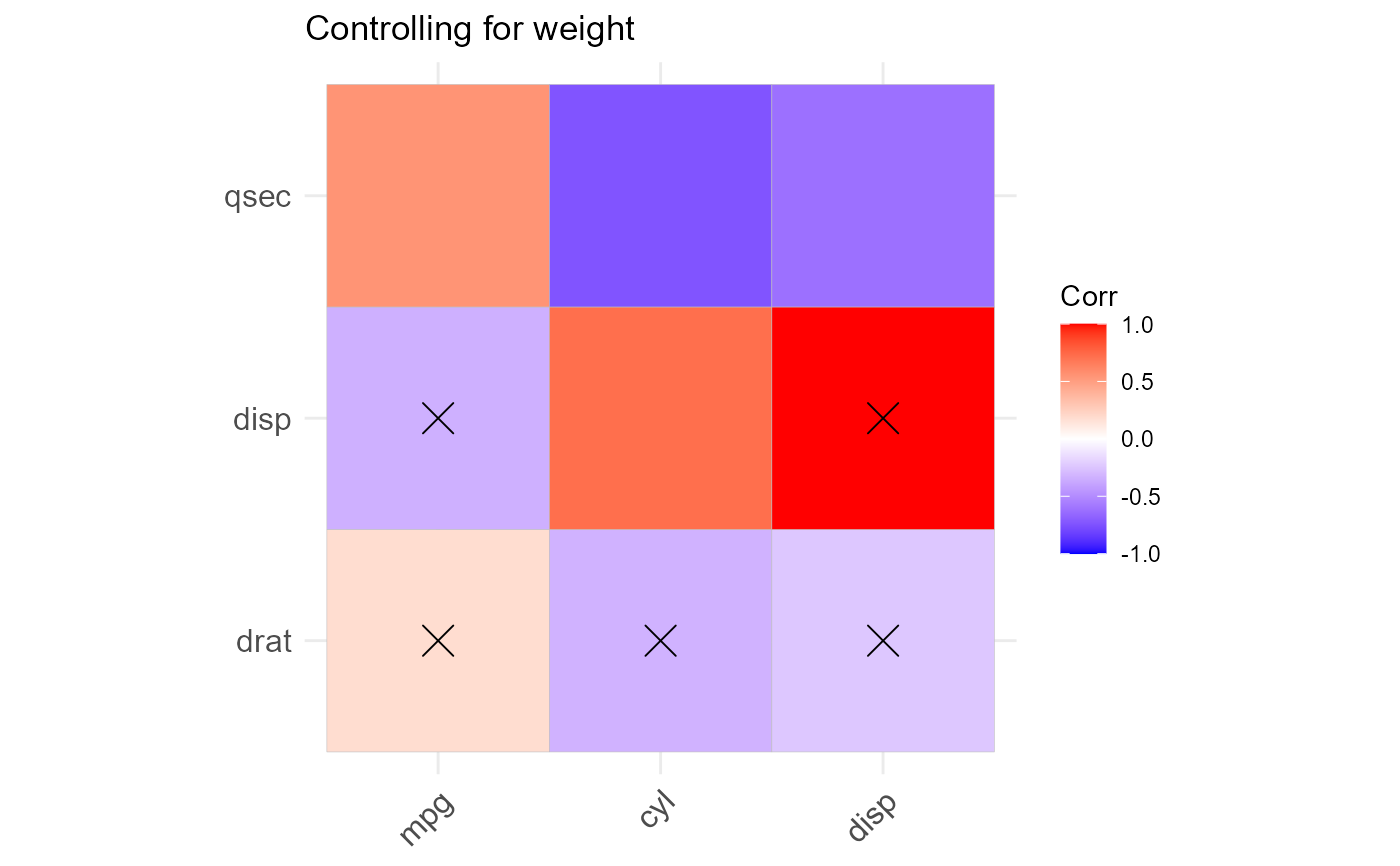
cor_mat <- corx(mtcars, x = c(mpg,cyl,disp), y = c(wt,drat,disp,qsec),
           z = wt, round = 2, stars = c(0.05),
           caption = "Controlling for weight" ,
           describe = list("mean" = function(x) mean(x,na.rm=TRUE)))
cor_mat
#> corx(data = mtcars, x = c(mpg, cyl, disp), y = c(wt, drat, disp,
#>     qsec), z = wt, stars = c(0.05), round = 2, caption = "Controlling for weight",
#>     describe = list(mean = function(x) mean(x, na.rm = TRUE)))
#>
#> Controlling for weight
#> ---------------------------
#>      drat disp  qsec   mean
#> ---------------------------
#> mpg   .18 -.34  .55*  20.09
#> cyl  -.33 .72* -.74*   6.19
#> disp -.24   -  -.62* 230.72
#> ---------------------------
#> Note. * p < 0.05
coef(cor_mat)
#>            drat       disp       qsec
#> mpg   0.1806278 -0.3371636  0.5456251
#> cyl  -0.3260334  0.7235673 -0.7413854
#> disp -0.2404013  1.0000000 -0.6151686
cor_mat$p
#>            drat         disp         qsec
#> mpg  0.33085441 6.361981e-02 1.499883e-03
#> cyl  0.07346184 4.234471e-06 1.830433e-06
#> disp 0.19267873 1.000000e+00 2.306237e-04
plot(cor_mat)

cor_2 <- corx(iris[,-5], describe = c(median, IQR = iqr, kurt = kurtosis),
         note = "Using shortcuts to select describe functions", triangle = "lower")
cor_2
#> corx(data = iris[, -5], triangle = "lower", note = "Using shortcuts to select describe functions",
#>     describe = c(median, IQR = iqr, kurt = kurtosis))
#>
#> ------------------------------------------------------
#>                      1       2      3 median  IQR kurt
#> ------------------------------------------------------
#> 1. Sepal.Length     -                   5.80 1.30 2.43
#> 2. Sepal.Width    -.12      -           3.00 0.50 3.18
#> 3. Petal.Length .87*** -.43***     -    4.35 3.50 1.60
#> 4. Petal.Width  .82*** -.37*** .96***   1.30 1.50 1.66
#> ------------------------------------------------------
#> Note. Using shortcuts to select describe functions